In November of 2022, an achievement report was presented to the Board of Education (BOE) and the public. There wasn’t a lot of noise around this report, and nobody seemed especially concerned. However, something about the numbers suggested a serious problem lurking in how they were presented.
The following month, during public comment, the board was given a second analysis. This was merely a quick reformatting of the information presented in November. Still, that simple change exposed a significant problem: as students progress through Montclair schools, their performance in mathematics progressively worsens. As the written form of that public comment indicates, this wasn’t a recent change but had been hidden in the data for some time.
I’ve since build some utilities which load outcome results into a database that permits a more detailed view.
Unfortunately, the story doesn’t improve with this broader view. Using the state Department of Education’s data from 2016-2017 to 2023-2024, a similar trend is visible if one follows cohorts through our schools. The following chart shows the percentage of students passing the appropriate math exam (achieving levels 4 or 5).
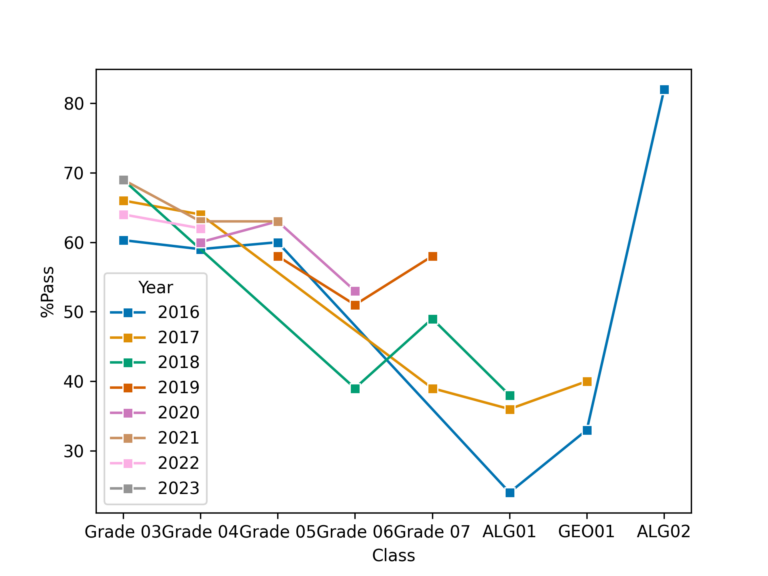
In this graph, the year shown is the year the cohort entered 3rd grade (the first year for which state data is available). As seen previously, the trend is generally downward until a sudden and remarkable leap in more advanced high school classes. I suspect that this result reflects the fact that, in middle and high school, some students are taking certain math classes earlier than others.
The actual passing percentages are as follows:
| Year | Grade 03 | Grade 04 | Grade 05 | Grade 06 | Grade 07 | ALG01 | GEO01 | ALG02 |
|---|---|---|---|---|---|---|---|---|
| 2016 | 60.3 | 59.0 | 60.0 | ** | ** | 24.0 | 33.0 | 82.0 |
| 2017 | 66.0 | 64.0 | ** | ** | 39.0 | 36.0 | 40.0 | ** |
| 2018 | 69.0 | ** | ** | 39.0 | 49.0 | 38.0 | ** | ** |
| 2019 | ** | ** | 58.0 | 51.0 | 58.0 | ** | ** | ** |
| 2020 | ** | 60.0 | 63.0 | 53.0 | ** | ** | ** | ** |
| 2021 | 69.0 | 63.0 | 63.0 | ** | ** | ** | ** | ** |
| 2022 | 64.0 | 62.0 | ** | ** | ** | ** | ** | ** |
| 2023 | 69.0 | ** | ** | ** | ** | ** | ** | ** |
Note that some data are missing. There is only one year of data for the cohort that entered 3rd grade in 2023, for example, because their 4th-grade results from 2024-2025 are not yet available from the state. This explains the missing data on the lower right of the table. The inner diagonal band of missing data represents the years during the worst of the Covid-19 pandemic when testing was not performed.
Even if we ignore the trend shown in the graph above, the numbers themselves tell an unfortunate story. This table indicates that no result shows more than 69% of students meeting or exceeding expectations. In most cases, the percentage of successful students is below 65%, a failing grade for our schools.
A far more detailed plot of this data is:
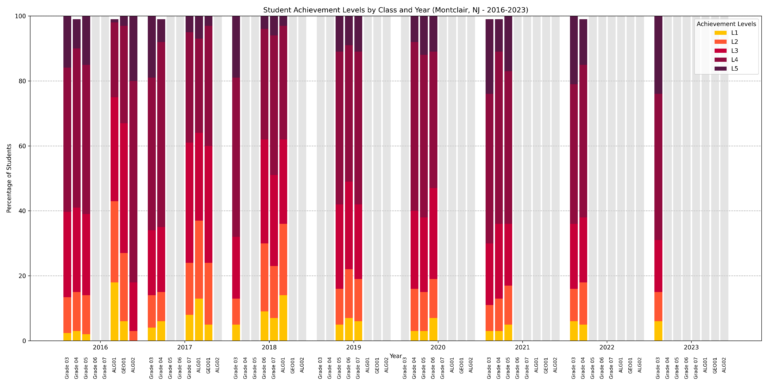
This shows a cluster of bar charts for each cohort. This plot is more complex than the previous graphic, but it shows the percentage of students achieving each level, with the gray bars indicating missing data. For example, in the 2016 cohort, we can see that the percentage of students achieving level one grows from 3rd grade to algebra, shrinks for geometry, and disappears for Algebra 2. This trend for level 1 is more pronounced with the 2017 cohort, with the caveat that the results for those students’ Algebra 2 are not yet available.
At the other end of the spectrum, we can see almost inverse results for students achieving level 5, where the percentage of students achieving level 5 decreases as the percentage achieving level 1 increases. There are, however, some interesting exceptions. For example, in the 2017 cohort’s algebra 1 results, both the percentage of students achieving level 1 and level 5 increased over the prior year. This also occurred in the 2021 cohort’s grade 5 results, and the reverse occurred in the 2022 cohort’s grade 4 results.
As noted above, this trend has been hidden within the data for years. To the district’s credit, following the public comment that exposed this issue in December 2022, subsequent achievement reports had begun providing some information in a manner that makes this trend more visible. Unfortunately, the person responsible for this reporting by the district has since resigned, and the position has been vacant for some time, although an RFP for a vendor to provide this service was recently released by the district (and discussed here).
The data behind this analysis is the public data made available by the Department of Education. The district has far more precise and timely data available, but does not appear to use this for reporting purposes. This is a problem. An analogy would be examining annual temperature measurements from past years to diagnose a fever.
Despite the lack of more detailed or timely reporting in public, the district appears to refer to reporting not shared with the board or the public. For example, a curriculum committee report states that “children showed growth” in response to the recently piloted Math 7 curriculum. Presumably, this is based on IXL results. I’m unclear why these results are not shared.
Given the limited level of detail available, there are numerous possible explanations for the declining trend in student performance in mathematics as they progress through our schools. A key consideration is that math is a highly cumulative subject; a student having difficulty in grade N is likely, absent intervention, to have trouble in grade N+1.
However, I believe one safe conclusion is that we’re not doing a good job in our K-5 classes of preparing all students in mathematics. While this affects how students perform in subsequent math classes, it also risks a more fundamental and long-term impact. As discussed in a recent report, “most high school grade youths who said they saw themselves as a math person identified as such in or before grade 5,” and “virtually all youths who identify as a math person identified themselves as such by the end of middle school, if not sooner.” The paper further suggests, “Given the early timing of students’ self-identification as a math person, it is especially important for elementary grade math teachers to cultivate positive math attitudes in students regardless of the track to which they are assigned.” Unsurprisingly, “Math comprehension, confidence, and subsequent enjoyment in middle school and high school are typically rooted in early formative experiences in the classroom and reflect a cumulative process of academic engagement that unfolds as students progress through school (Alexander, Entwisle, and Horsey, 1997).”
Fortunately, the district has been making an effort to correct our failure to offer all our elementary students the math education they need. Although initially planned for a prior year’s budget, the 2025-2026 budget finally includes the purchase of a new K-5 math curriculum. Whether this will solve the problem remains to be seen, but it is an attempt to do so.
The Board of Ed is taking this seriously enough that math outcomes were a part of the recent superintendent search process, as initiated by this slide in a presentation about that process.
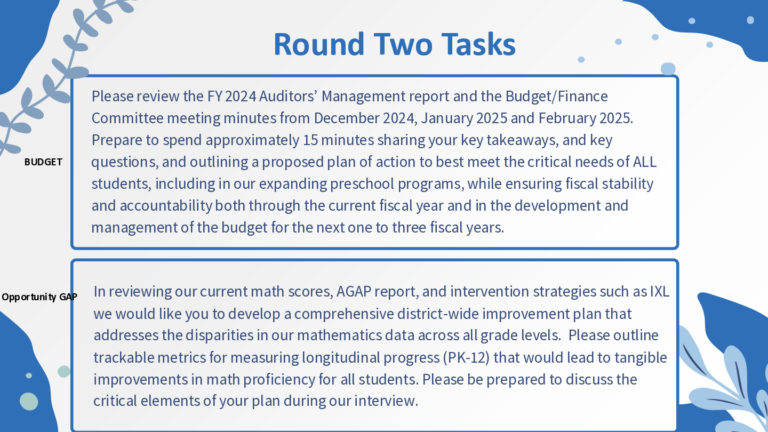
To the best of my knowledge, though, the plans offered by the round 2 candidates – including the candidate hired by the BOE – have not been made public. These would be interesting to see.
That the district is making changes intended to improve math education, and that the BOE is taking this issue seriously, are necessary but insufficient. We must also measure results to determine whether this is working. The time lag and lack of detail render the state’s data ineffective for this purpose. We cannot wait years to learn whether this is helping. That is unfair to students we’re failing to help. The district must commit to timely reporting of the results of this attempt to solve our long-term problem of K-5 math education. That will let us know whether this is a solved problem or whether further improvements are required.
We must also ensure that all teachers receive the necessary training to make the best possible use of the new curriculum. This is as much about subject matter comfort and expertise as it is about specifics of the curriculum. As the study cited earlier also notes, successful strategies identified by research include “Model enjoyment of math to transmit the emotion to students (Frenzel et al., 2018; Keller et al., 2014; Morrish et al., 2018; Quoidbach, Mikolajczak, and Gross, 2015). Teachers who enjoy the material are more likely to explain why it is interesting, which helps students value the material (Cui, Yao, and Zhang, 2017).”
Our students have been experiencing declining performance in math as they advance through our classes for years. Additionally, no test results showed that less than 30% of students failed to meet expectations. Not one. Despite some misguided attempts to further delay our response to this unfortunate and long-standing problem, correcting this and providing a successful education in math for all our students must be a district priority. This includes not merely attempted improvements, but ongoing measurement of results that enable us to quickly determine whether further changes are required and what those might be.
After many years, it’s time for our students to receive the education they deserve, and we need to ensure that we’re doing so.